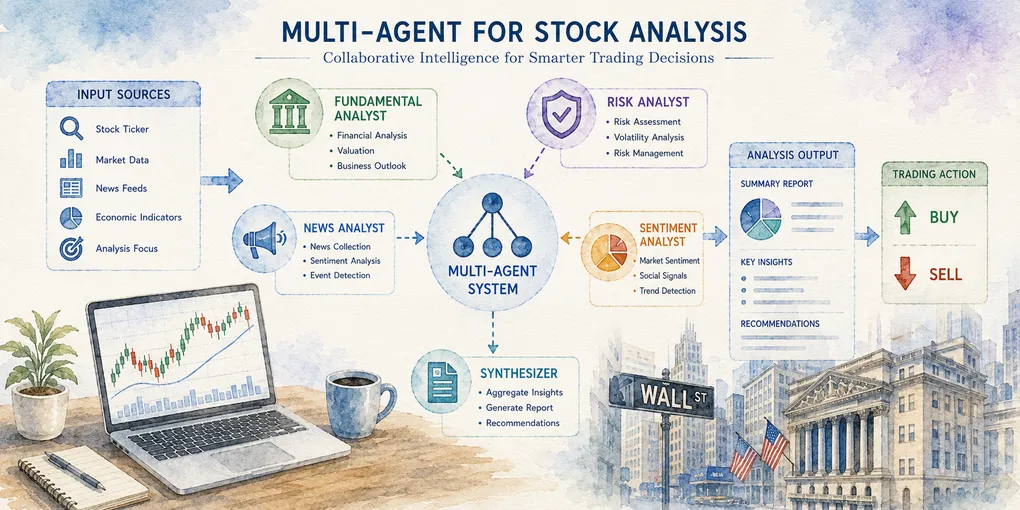
Implementing the Parallel Fan-Out/Gather Pattern on Microsoft Foundry: A Stock Analysis Example
⚠️ This post uses stock analysis as one example use case to test a multi-agent prototype’s design and implementation. Nothing shown here is a recommendation to buy or sell any specific financial instrument.
Keywords: Multi-Agent, Parallel Fan-Out/Gather, Microsoft Foundry, Parallel Execution, Multimodal, Final Synthesizer, Deterministic Orchestration
Hi, I’m Lena Nadir.
Building a single AI agent isn’t all that hard anymore.
But once you combine multiple agents into a multi-agent system, you run into questions like:
- How far do you split up responsibilities?
- Do you run steps sequentially or in parallel?
- Do you need a router or a supervisor?
- Where do you gather results, and where do you interpret them?
These orchestration design questions become critical.
So this time, I implemented the Parallel Fan-Out/Gather Pattern using Microsoft Foundry.
The use case: analyzing an individual stock from multiple specialist perspectives to evaluate the entry point for a roughly 2-3 month swing trade. The goal isn’t to have AI predict the stock price itself.
For an entry decision, the Fundamental Analyst evaluates company performance and growth, while the Risk Analyst evaluates the current price level and price action. These two analyses can run independently and be combined only at the end. Other factors, such as short-term supply and demand, could also be incorporated. For this prototype, however, I intentionally limit the scope to these two perspectives. Running multiple analyses that don’t depend on each other in parallel, then combining the results at the end — that’s exactly the kind of structure the Parallel Fan-Out/Gather Pattern is good at.
Split different areas of expertise across multiple agents, run them in parallel, then merge the results into a single decision input.
In this post, I’ll first explain why I chose this design pattern, then walk through the Microsoft Foundry and Python implementation, all the way to the actual output.
🧩 What Is the Parallel Fan-Out/Gather Pattern?
The Google Developers site covers several representative design patterns for multi-agent systems: Sequential Pipeline, Coordinator/Dispatcher, Parallel Fan-Out/Gather, Hierarchical Decomposition, Generator & Critic, Iterative Refinement, and more.
To make the differences between these patterns easier to grasp, I organized them into the diagram below.
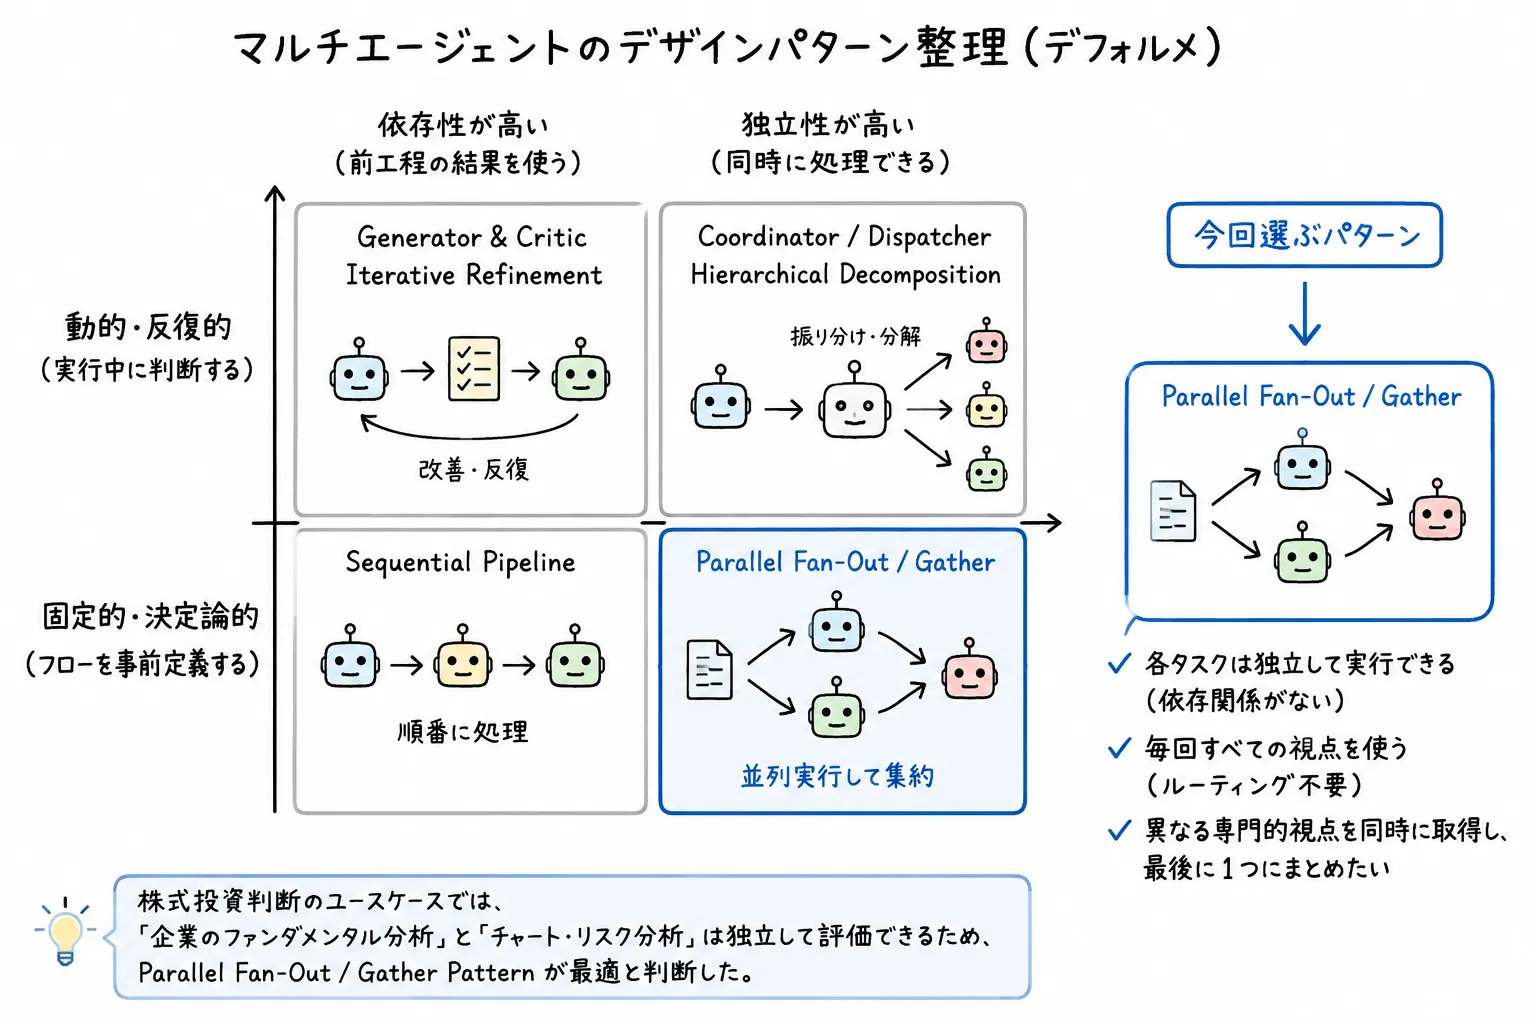
I adopted the Parallel Fan-Out/Gather Pattern here: run the Fundamental Analyst and Risk Analyst independently in parallel, then merge the results at the end. Since both agents run on every single request, there’s no need for a router.
Run multiple independent specialist analyses in parallel, then merge the results at the end
🏗️ Architecture and Component Roles
This multi-agent setup consists of five components.
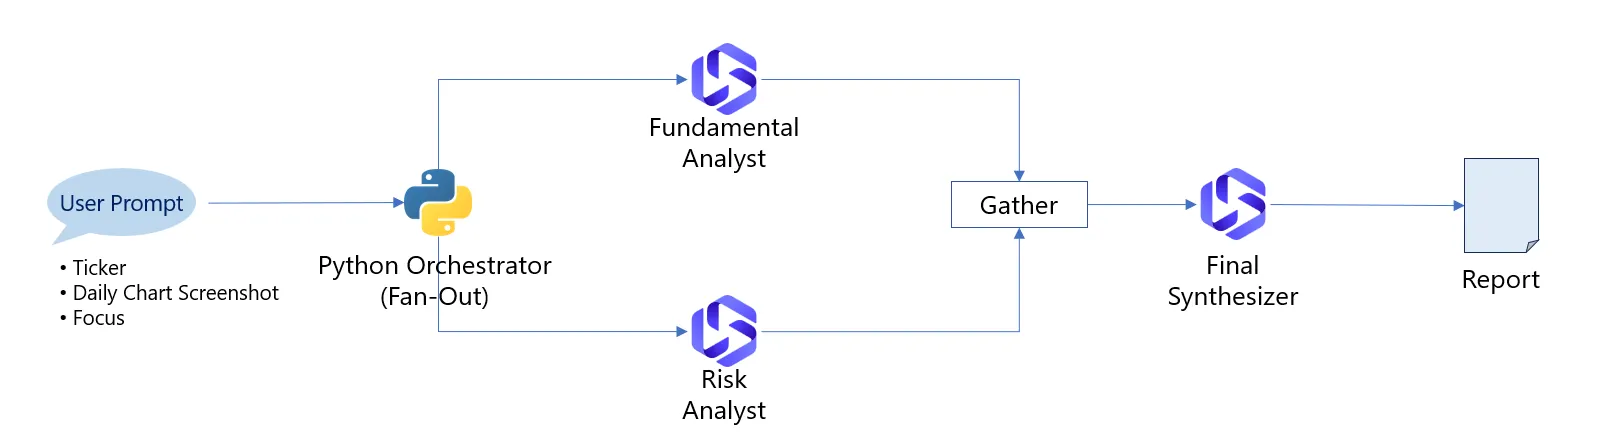
Here’s what each component is responsible for:
-
Fan-Out
- The Python Orchestrator takes a single input and fans it out to the Fundamental Analyst and Risk Analyst, running both in parallel
-
Fundamental Analyst
- Researches public information based on the ticker
- Checks the latest earnings, revenue/profit, EPS, profitability, valuation, and guidance
- Identifies catalysts that could move the stock over the next 2-3 months
- Evaluates the current investment environment from the company’s side
- Uses Grounding with Bing Search to pull in public information
-
Risk Analyst
- Analyzes the daily chart screenshot the user provides
- Checks trend, support/resistance, recent highs/lows, volume, and where the current price sits
- Evaluates risk/reward for a 2-3 month swing trade
- Evaluates entry risk from the market/price-action side
- Doesn’t reference company performance — judgment is limited to the chart image
-
Gather
- Collects the outputs of both agents on the Python side once they’ve run in parallel
- No interpretation or conclusion-drawing happens at this stage yet
-
Final Synthesizer
- Receives the gathered results from the Fundamental Analyst and Risk Analyst
- Sorts out where the two agree, where they differ, the catalysts, and the risks
- Combines the fundamental setup and chart setup into a single analysis report
The specialist agents do not communicate directly with each other. The Python Orchestrator collects their outputs, and the Final Synthesizer interprets and combines them.
📥 Input Data
For this experiment, I use Fujikura (5803.T), a Japanese company listed on the Tokyo Stock Exchange Prime Market, as the sample stock.
The input data is defined as JSON.
{
  "ticker": "5803.T",
  "company_name": "Fujikura Ltd.",
  "market": "Tokyo Stock Exchange Prime Market",
  "chart": "./input/5803-Fujikura_20260825.png",
  "focus": "Given a roughly 2-3 month swing trade horizon, is now an attractive entry point?"
}
The chart screenshot comes from a Japanese trading app, but the Risk Analyst receives the image directly and analyzes the visible price action, support/resistance levels, and volume.
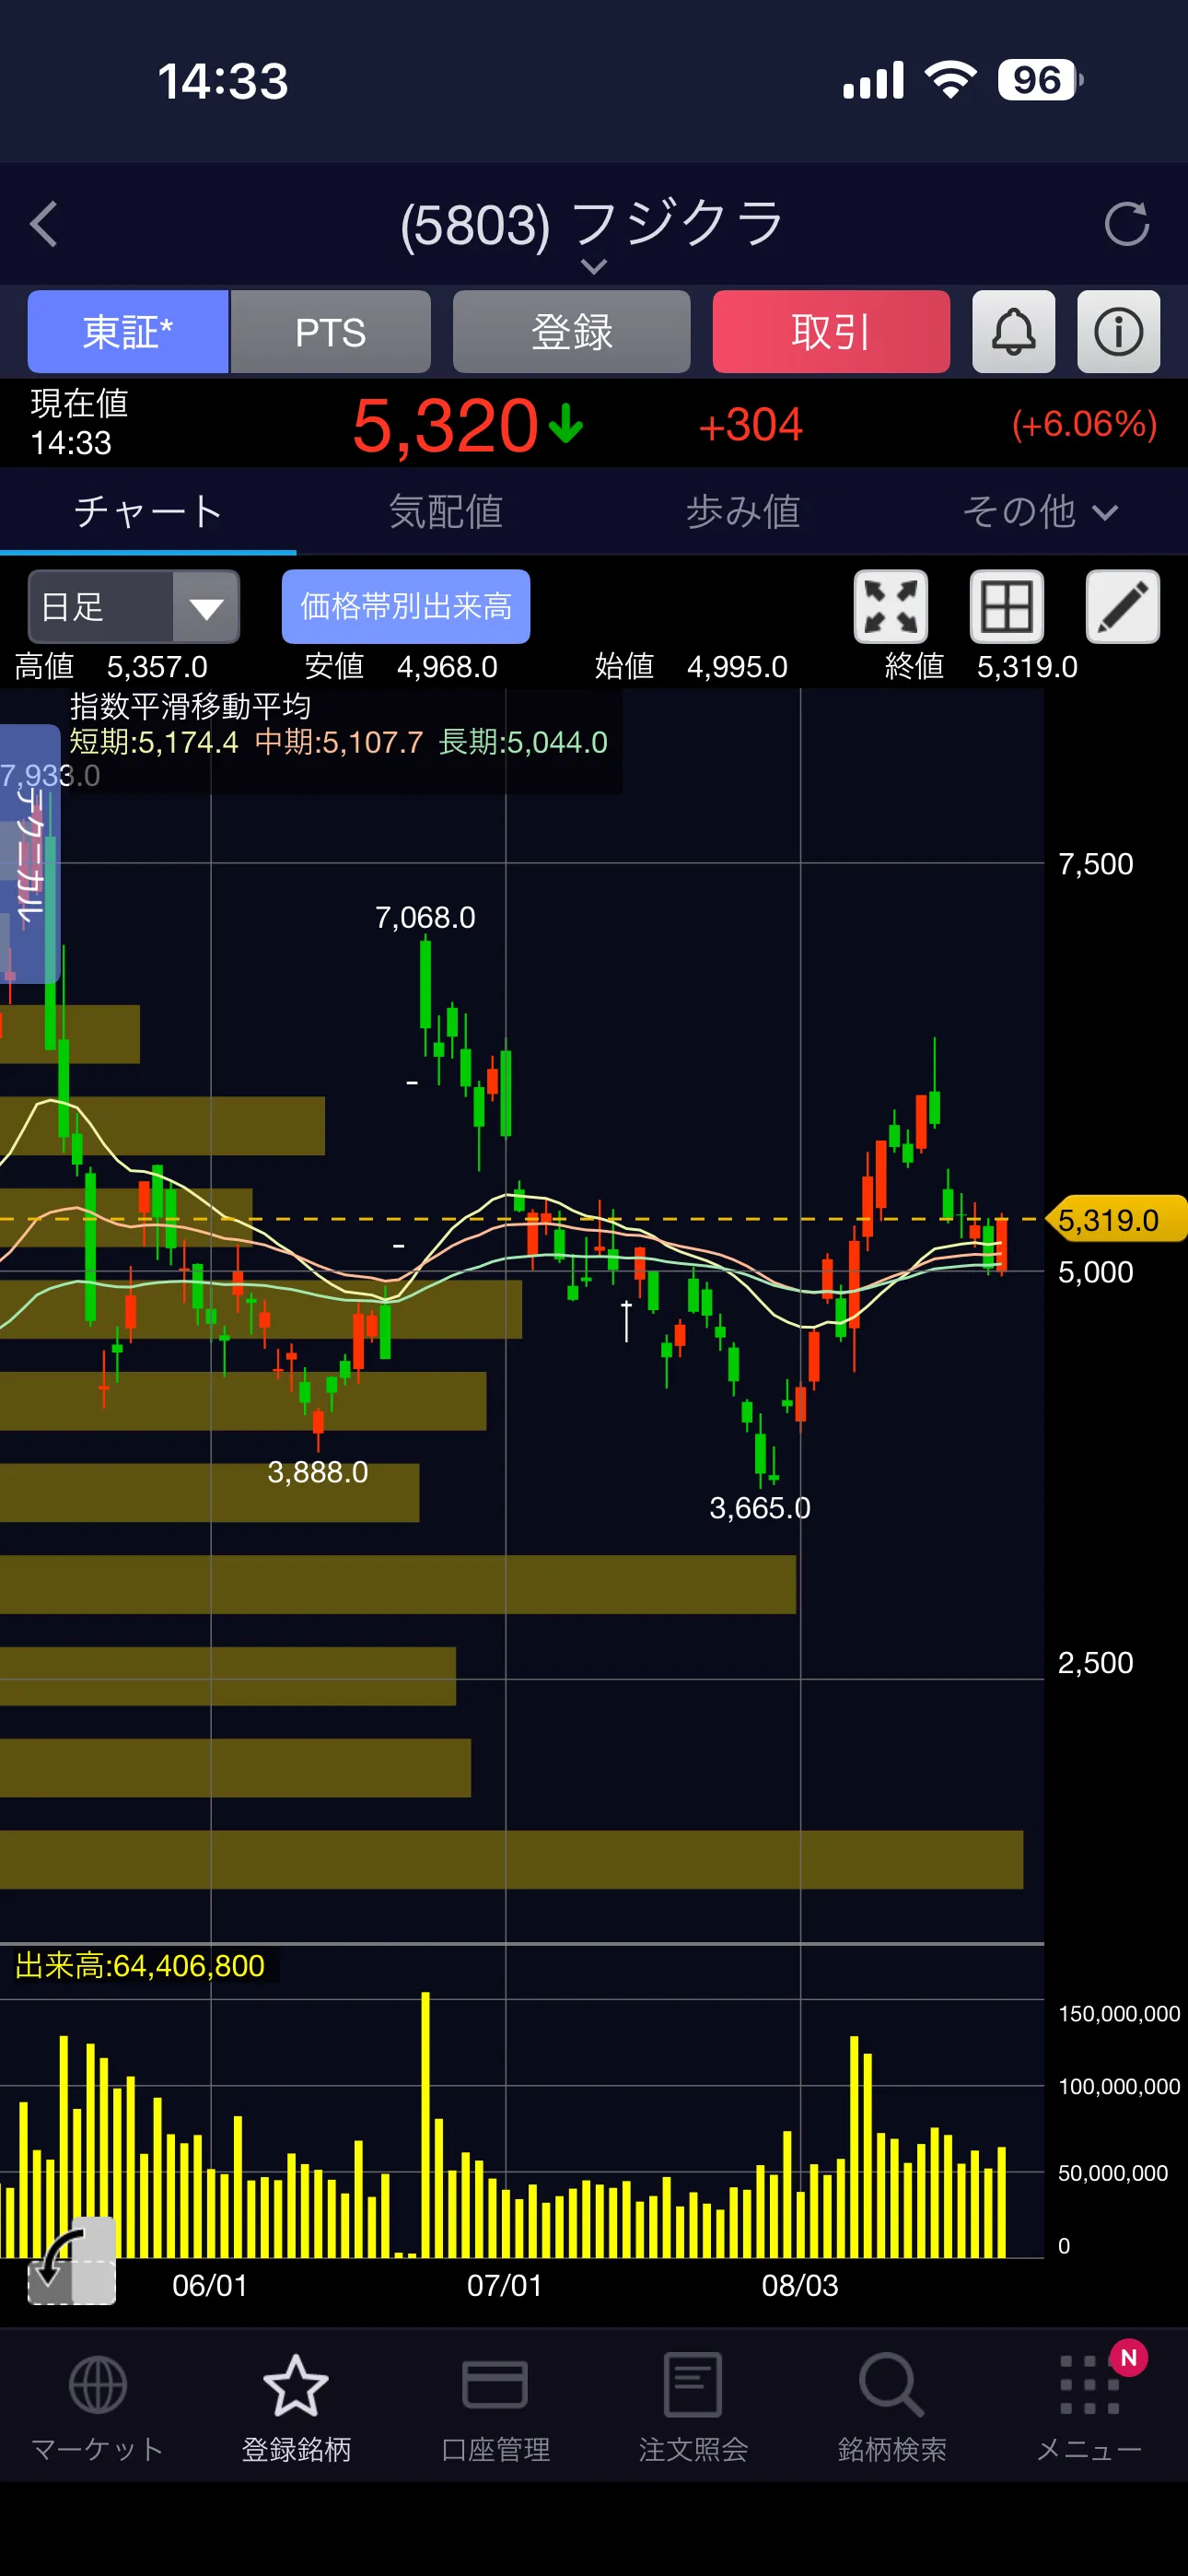
This time, I didn’t pull daily price data from a stock API or compute technical indicators like RSI or MACD in Python. That’s because the design isn’t about automating indicator-based technical analysis — it’s about having the Fundamental Analyst and Risk Analyst each evaluate the entry point from an independent perspective, based on public information and the daily chart, respectively.
There’s certainly a trading style where you’d feed technical indicators into an agent for a more quantitative buy/sell decision. I didn’t take that approach here, so the division of labor across agents stays clear.
🧪 Experiment
From here, I’ll invoke the three agents defined in Microsoft Foundry from Python.
The main libraries used in this experiment are:
agent-framework-core
agent-framework-foundry
azure-identity
pydantic>=2.0
python-dotenv
On the Python side, I create a client that connects to Microsoft Foundry, then initialize the Fundamental Analyst, Risk Analyst, and Final Synthesizer.
# Create a single Client connected to the Microsoft Foundry project,
# and reuse it across all three agents
client = agents.build_client()

# Initialize the three agents already defined in Foundry, one per role
fundamental_agent = agents.build_fundamental_agent(client)   # Analyzes company fundamentals
risk_agent = agents.build_risk_agent(client)                 # Analyzes risk/entry from the chart image
synthesizer_agent = agents.build_synthesizer_agent(client)   # Merges both analyses into one report
Running the Fundamental Analyst and Risk Analyst in Parallel
The heart of the Parallel Fan-Out/Gather Pattern here is running the two specialist agents in parallel.
In Python, I use asyncio.gather() to call the Fundamental Analyst and Risk Analyst at the same time.
import asyncio

# Passing two coroutines to asyncio.gather() schedules them concurrently.
# This avoids waiting for one specialist to finish before starting the other.
# In this architecture, this is the Fan-Out stage.
fundamental_result, risk_result = await asyncio.gather(
    # Call the Fundamental Analyst with the ticker, focus, company name, and market, and await its response
    agents.run_fundamental_analyst(
        fundamental_agent,
        ticker,
        focus,
        company_name,
        market,
    ),
    # Call the Risk Analyst with the same inputs plus the daily chart image path, and await its response
    agents.run_risk_analyst(
        risk_agent,
        ticker,
        str(chart_path),
        focus,
        company_name,
        market,
    ),
)
# Once both calls complete, their responses come back together as a tuple
You can see the two agents kick off in parallel in the execution log too.
[1/3] Running Fundamental Analyst / Risk Analyst in parallel...This step is what corresponds to Fan-Out in this architecture.
Input to the Fundamental Analyst
The Fundamental Analyst receives the ticker, company name, market, and analysis focus.
Ticker:
5803.T

Company Name:
Fujikura

Market:
Tokyo Stock Exchange Prime Market

Analysis Focus:
Given a roughly 2-3 month swing trade horizon,
is now an attractive entry point?

Research public information on the above
and perform a Fundamental Analysis.
The Fundamental Analyst uses Grounding with Bing Search to research public information and analyze performance, valuation, and short-term catalysts.
Input to the Risk Analyst
The Risk Analyst receives the same analysis focus, along with the daily chart image.
Ticker:
5803.T

Company Name:
Fujikura

Analysis Focus:
Given a roughly 2-3 month swing trade horizon,
is now an attractive entry point?

Analyze the attached daily chart image
and perform a Risk Analysis.

Do not guess at information you can't read from the image.
The Risk Analyst doesn’t touch company performance — it analyzes price action and entry risk purely from the chart image.
These two agents run independently, without referencing each other’s output.
Gathering the Specialist Outputs
Once asyncio.gather() completes, the two analysis results end up stored in fundamental_result and risk_result on the Python side.
From there, I pass both results to the Final Synthesizer, which merges them into a single report.
# Pass the two gathered results to the Final Synthesizer together,
# so it can interpret their overlaps and differences and merge them into one report
final_report = await agents.run_synthesizer(
    synthesizer_agent,
    ticker,
    focus,
    fundamental_result,   # The Fundamental Analyst's result
    risk_result,          # The Risk Analyst's result
)
📊 Results
This run produced the following results from the Fundamental Analyst and Risk Analyst.
| Agent | Verdict | Key reasoning |
|---|---|---|
| Fundamental Analyst | Positive | Positive on revenue growth, improving profitability, upward earnings revisions, and demand tied to optical fiber and data centers. On the downside: high growth expectations and valuation |
| Risk Analyst | Neutral | Bounced off ¥3,665, but consolidating around ¥5,000-5,300. Neither a clear deep pullback nor a breakout — risk/reward is neutral |
Here’s the actual report the Final Synthesizer produced. It combined a positive fundamental view with a neutral chart assessment, resulting in an overall Entry Setup of Neutral.
# 5803.T (Fujikura)

**Entry Setup:** Neutral (Fundamental: Positive / Chart: Neutral)

Fundamentals are strong on business expansion and an upward earnings-revision trend,
keeping attention high even on a 2-3 month horizon. The chart, though, is consolidating
around ¥5,300 against overhead resistance — the current level is neither a low-risk pullback
buy nor a clear breakout, so entry appeal is somewhat neutral given how strong the
fundamentals are.


*For research and educational purposes only. Not investment advice.*
💰 Cost per Run
I estimated token counts for the three agents based on the length of their instructions and prompts.
| Agent | Approx. Input | Approx. Output |
|---|---|---|
| Fundamental Analyst | ~1,700 tokens | ~300-600 tokens |
| Risk Analyst | ~1,200 tokens + image | ~300-500 tokens |
| Final Synthesizer | ~2,500-2,900 tokens | ~1,100-2,300 tokens |
Overall, that’s roughly:
- Input: ~6,000-7,000 tokens
- Output: ~2,500-3,500 tokens
Based on the pricing for the model I used, the model-call portion alone comes out to roughly $0.06-$0.10 per run.
That said, the Fundamental Analyst uses Grounding with Bing Search, so search transaction fees apply on top of that. Token usage for the image input also varies with resolution.
For an accurate figure, check the actual usage and billing data in Azure Cost Management / Foundry.
⚠️ Some Parts of the SDK Are Still Experimental
The run itself completed fine, but around Grounding with Bing Search,
PydanticSerializationUnexpectedValuethis warning showed up several times.
There’s also this:
ExperimentalWarning:
RawFoundryChatClient.get_bing_grounding_tool is experimental
For this PoC, the flow completed successfully despite these warnings, but there are still experimental APIs around Foundry / Agent Framework. For production use, pinning the SDK version and monitoring API changes would be advisable.
⚖️ Scaling Considerations: Agent Count × Number of Tickers
This implementation used just two specialists: the Fundamental Analyst and the Risk Analyst. You could break stock analysis down further and add more agents — a Fundamental Analyst, Valuation Analyst, Technical Analyst, News Analyst, Macro Analyst, and Sector Analyst, say.
But adding more agents doesn’t improve analysis quality proportionally.
As the number of agents grows, so do:
- Token cost
- Latency
- Conflicts between agents
- Orchestration overhead
- Surface area to debug
A big reason I kept it to two agents is that the Fundamental Analyst and Risk Analyst each have a clearly distinct input and responsibility.
On the other hand, when you think about scaling the number of tickers you process — say, expanding to hundreds or thousands of tickers a day - you need ticker-level distributed processing on top of the parallel execution between specialist agents. Take a look at the comparison below.
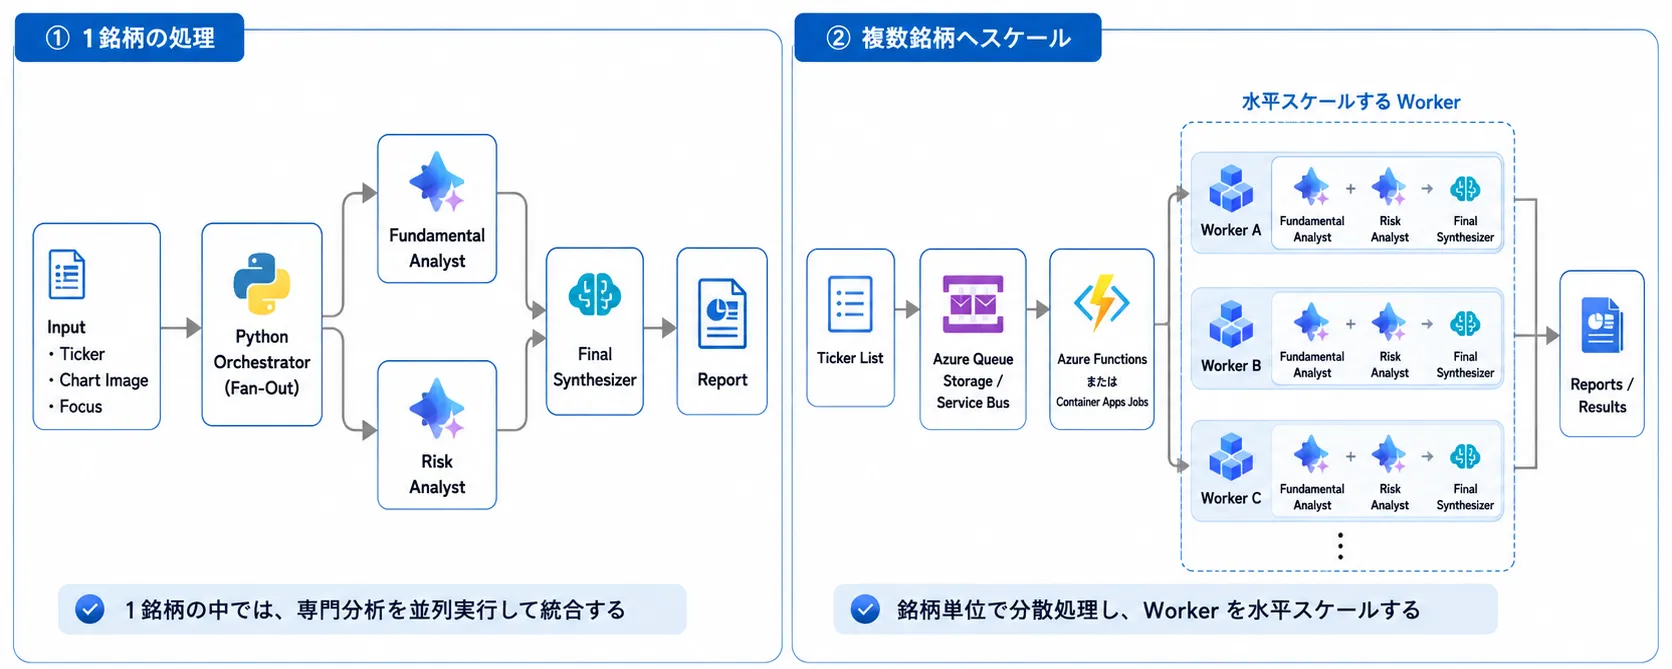
Within a single ticker, this uses Parallel Fan-Out/Gather — running the Fundamental Analyst and Risk Analyst in parallel and merging them in the Final Synthesizer. When scaling to multiple tickers, you distribute that whole process per ticker. One workable setup: queue the ticker list (in Azure Queue Storage or Service Bus), horizontally scale workers via Azure Functions or Container Apps Jobs, and have each worker run the full Fundamental Analyst → Risk Analyst → Final Synthesizer sequence.
That said, adding more workers doesn’t let you scale processing infinitely.
In production, you’d need to account for at least the following:
- LLM rate limits / quota
- RPM (Requests per Minute)
- TPM (Tokens per Minute)
- Concurrency limits
- Grounding with Bing Search usage limits
- Search transaction count
- Concurrency
- Billing
- Token cost
- Scales with number of tickers × number of agents
- Retry/timeout handling
- For transient 429s and external service failures
- Backpressure
- Throttling how fast you pull from the queue so you don’t exceed downstream service quotas
In other words, this setup involves two separate layers of parallelism:
- Within a single ticker, run the Fundamental Analyst and Risk Analyst in parallel
- When scaling to multiple tickers, distribute workers per ticker
and you need to think about each layer separately.
Design the parallel execution within a single ticker and the distributed processing across many tickers as separate layers.
🏁 Wrap-up
In this post, I implemented the Parallel Fan-Out/Gather Pattern on Microsoft Foundry.
In the actual entry-point evaluation for Fujikura (5803.T), the final result was:
Fundamental → Positive
Chart       → Neutral
Entry Setup → Neutral
By separating a company’s fundamentals from its current entry timing into two different agents, I was able to distinguish “Is this fundamentally a strong company?” from “Is this an attractive entry point right now?” without conflating the two — a clear benefit of this multi-agent setup.
On the other hand, as the number of dedicated analysis agents and the number of tickers grow, cost and complexity are likely to snowball.
This stock-analysis scenario proved to be a clean use case for demonstrating where the Parallel Fan-Out/Gather Pattern fits well.
References
- Developer’s guide to multi-agent patterns in ADK (Google Developers Blog)
- Microsoft Agent Framework — Concurrent orchestration (Microsoft Learn)
This post is a technical proof-of-concept for multi-agent systems. The tickers and analysis results shown are not investment advice.